Monitor - Switch
Devices
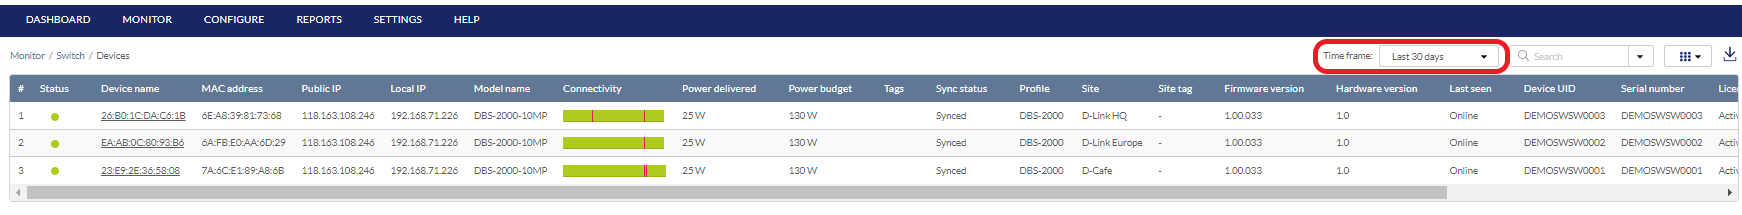
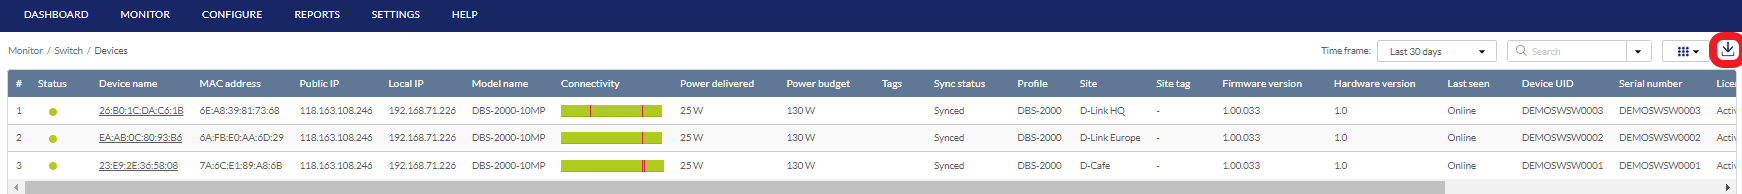
From the Devices window, you can consult a detailed log of events occurring on the network. You can also filter events using specific event filter parameters, including event type and time period.
The Device Monitor
Customizing the Device Monitor Overview
- Navigate to Monitor > Switch > Devices.
- Select a time frame from the drop-down menu to set the duration for connectivity information.
- Click the filter parameter icon.
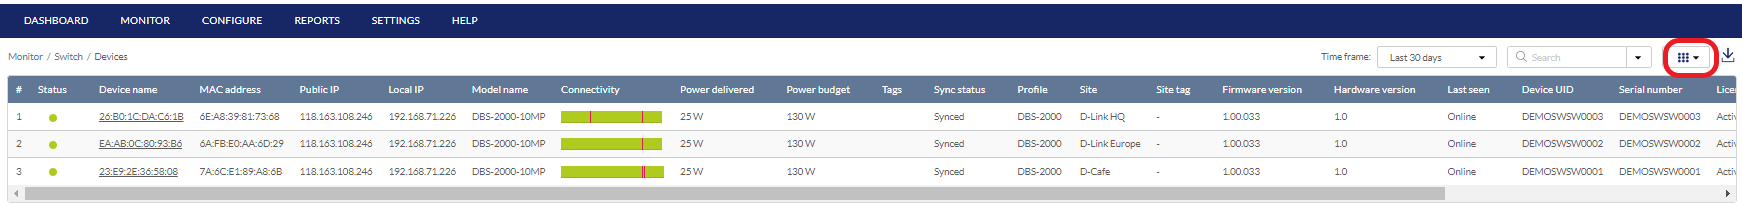
- Click the checkbox next to the parameters to display them in the overview.
Note: All checked parameters will automatically appear.
Downloading Device Monitoring Logs
- Navigate to Monitor > Switch > Devices.
- From the device list, click the Download icon in the top-right.
Device Basic Settings
Changing the Device Site and Profile
- Navigate to Monitor > Switch > Devices and select a device from the list.
- Select the Basic tab at the top.
- In the Site and Profile section, select a Site from the drop-down menu.
- In the Site and Profile section, select a Profile from the drop-down menu.
- Click Apply.
Changing the Device Connection Type to DHCP
- Navigate to Monitor > Switch > Devices and select a device from the list.
- Select the Basic tab at the top.
- In the IP Connection section, select a DHCP as the Type.
Note: Changing the connection type may disrupt the connection to the Nuclias Cloud. - When prompted to confirm, click Yes.
- Select a VLAN ID from the drop-down menu to assign the switch to a VLAN.
Note: VLAN and Voice VLAN settings can be configured on the Profile's Settings page. Refer to the Configuring Basic Switch Profile Settings section for more information. - Click Apply.
Changing the Device Connection to Static IP
- Navigate to Monitor > Switch > Devices and select a device from the list.
- Select the Basic tab at the top.
- In the IP Connection section, select Static IP as the Type.
Note: Changing the connection type may disrupt the connection to the Nuclias Cloud. - When prompted to confirm, click Yes.
- Specify the following information:
|
Local IP |
Enter a valid IP address. |
|
Management VLAN |
Select a VLAN to be the management VLAN. This segments management traffic. Make sure that at least one member port belongs to the management VLAN to allow access to the management functions of the switch. |
|
Enter the Subnet Mask. |
|
|
Enter the default gateway address. |
|
|
DNS #1 |
Enter a primary DNS address. |
|
DNS #2 |
[Optional] Enter a secondary DNS server address. |
|
DNS #3 |
[Optional] Enter a tertiary DNS server address. |
| Proxy | [Optional] Enable or disable the use of DNS proxy. If enabled, enter the proxy host's IP address or domain name and port number (1-65535). |
- Click Apply.
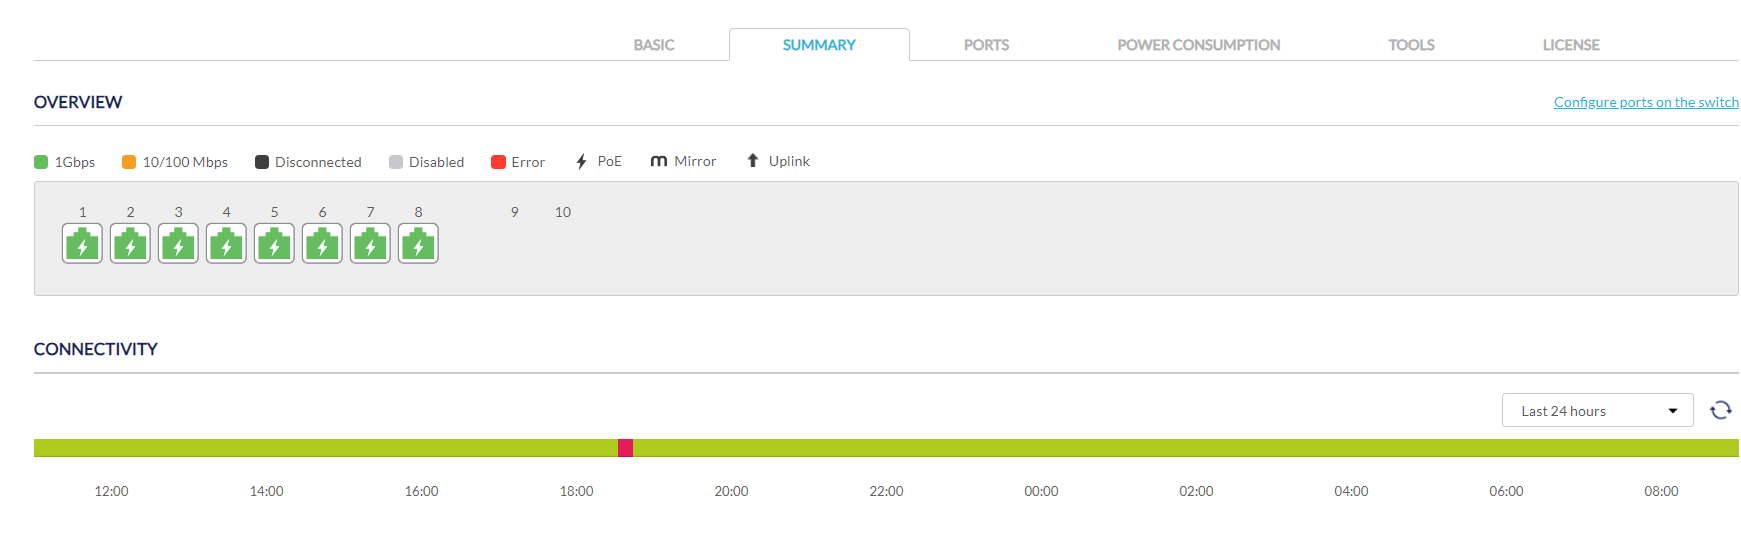
The Performance Summary
Viewing and Customizing the Switch Performance Summary
- Navigate to Monitor > Switch > Devices and select a device from the list.
- Select the Summary tab at the top.
- In the Connectivity and CPU Utilization sections, select a time frame from the drop-down menu to show data for the specified time frame. Click the refresh icon to renew the data.
- [Optional] Click on a port on the interactive switch diagram to view port-specific information.
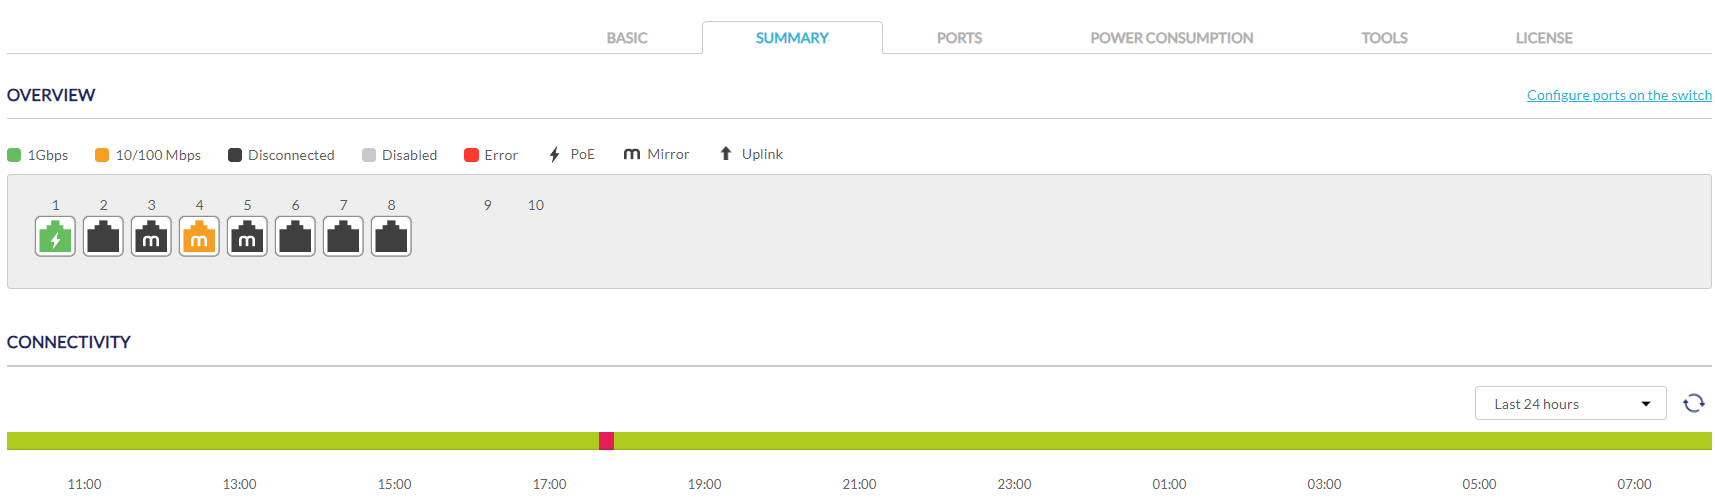
- [Optional] Click Configure ports on the switch to go to the switch port configuration window. Refer to the Switch Ports section for more information.
Ports Status
Viewing and Customizing the Switch Port Status Overview
- Navigate to Monitor > Switch > Devices and select a device from the list.
- Select the Ports tab at the top.
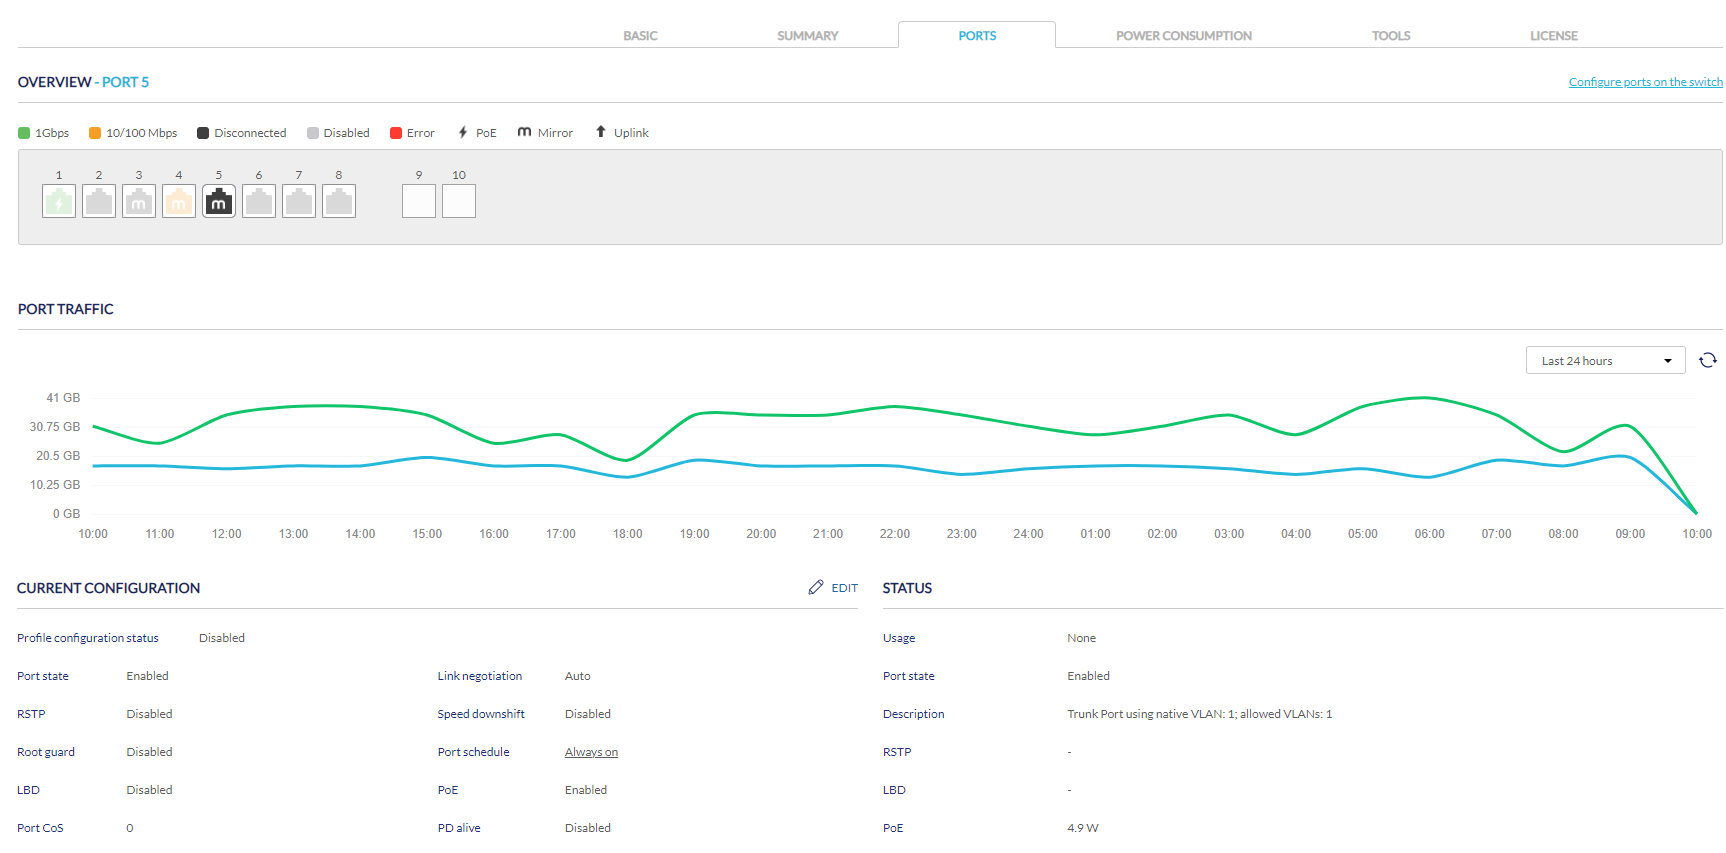
- Click on a port on the interactive switch diagram to view specific information for that port.
- Select a time frame from the drop-down menu to show data for the specified time frame. Click the refresh icon to renew the data.
- In the Current Configuration section, click Edit to configure the selected port’s settings. Specify the following information:
|
Port Name |
Enter a name for the port. If multiple ports are selected, this name will be applied to all ports. |
|
Port State |
Choose to enable or disable the port. |
|
Choose to enable or disable RSTP. Note: RSTP cannot be used in conjunction with LBD. Note: User must enable Profile>Settings>STP Configuration for this port to enable RSTP |
|
|
STP Guard |
If RSTP is enabled, choose the guard type. Disabled: Do not use root guard enhancement. Root guard: Root guard enhancement allows administrators to define the position of the root bridge port in the network. |
|
Choose to enable or disable LBD. Note: LBD cannot be used in conjunction with RSTP. |
|
| Port CoS | Select a value for Cos value (0-7). |
|
Type |
Choose the function type of the port. Trunk: Sends and receives tagged data from different VLANs. Access: Only sends and receives untagged data from the VLAN the port belongs to. |
|
Native VLAN |
Enter the ID of the native VLAN the port belongs to if the Trunk type is selected. |
|
Allowed VLANs |
Enter the IDs of the VLANs that can route traffic through this port if the Trunk type is selected. Enter All to allow all traffic from all VLANs to pass through this port. |
| Access VLAN |
Enter the ID of the VLAN the port belongs to if the Access type is selected. |
| Access Policy |
Select the Access Policy for this port if the Access type is selected. The options include Disabled, MAC Whitelist, Port Security Delete-on-Time Mode, and Port Security Permanent Mode. MAC Whitelist: Allows only the specified MAC addresses in the Static Whitelisted MACs. Port Security Delete-on-Time Mode: All learned MAC addresses have a limited lifetime and will be erased when the lifetime is reached. Port Security Permanent Mode: Allows the MAC addresses learned through this port. The number of allowed addresses is set by Dynamic Whitelist Size Limit. When the number of Dynamic Whitelisted MACs reaches this limit, new devices will be denied access to this port. |
| Static Whitelisted MACs | Enter the MAC addresses that can access this port to restrict access to this port to devices with specific MAC addresses. If entering multiple MAC addresses, enter only one address per line. |
| Dynamic Whitelist Size Limit |
Enter the maximum number of allowed MAC addresses that the device should learn dynamically for the Port Security Delete-on-time Mode or Port Security Permanent Mode. |
| Dynamic Whitelisted MACs |
Display the learned MAC addresses for the Port Security Delete-on-time mode and Port Security Permanent Mode. |
|
Tags |
Enter a descriptive tag for the port. Multiple tags can be entered. If multiple ports are selected, tags will be applied to all ports. |
|
Link (RJ45) |
Choose the maximum link speed of the port. Select Auto to allow the port to auto-negotiate port speed with the partner port or device. |
|
Link (SFP) |
Choose the maximum link speed of the port. Select Auto to allow the port to auto-negotiate port speed with the partner port or device. |
| Speed Downshift |
Enables/disables automatic speed downshift on the supported interface when the designated maximum speed cannot be established. |
|
Choose to enable or disable Power over Ethernet (PoE) functionality on this port. Note: The PoE setting will only apply to ports that support Power over Ethernet. |
|
| PD Alive | Enable or disable the automatic detection of the Powered Devices status. |
| PD IP Address | Enter the IP address of the Powered Device. |
|
Port Schedule |
Choose a pre-configured schedule policy. Go to Configure > Schedule policies to access the configured schedules. |
| Traffic Segmentation | Enable or disable traffic segmentation on this port to further restrict traffic flow in your network. If enabled, select the forward ports. |
| Forward Ports | Select the forward ports if traffic segmentation is enabled. |
| Flow Control | Enable or disable the flow control on the port to regulate the data transfer rate between two devices. |
- Click Apply.
- In the Cable Test window of the Troubleshooting section, click Test to perform a cable test on this port. This will scan the physical connection to the port for any problems.
- In the Cycle Port window of the Troubleshooting section, click Test to perform a port cycle test on this port. This will disable and re-enable the port.
- In the Overview Packets section, select a time frame from the drop-down menu to display data for different packet types (e.g. broadcast , CRC error, or collision) for the selected time period.
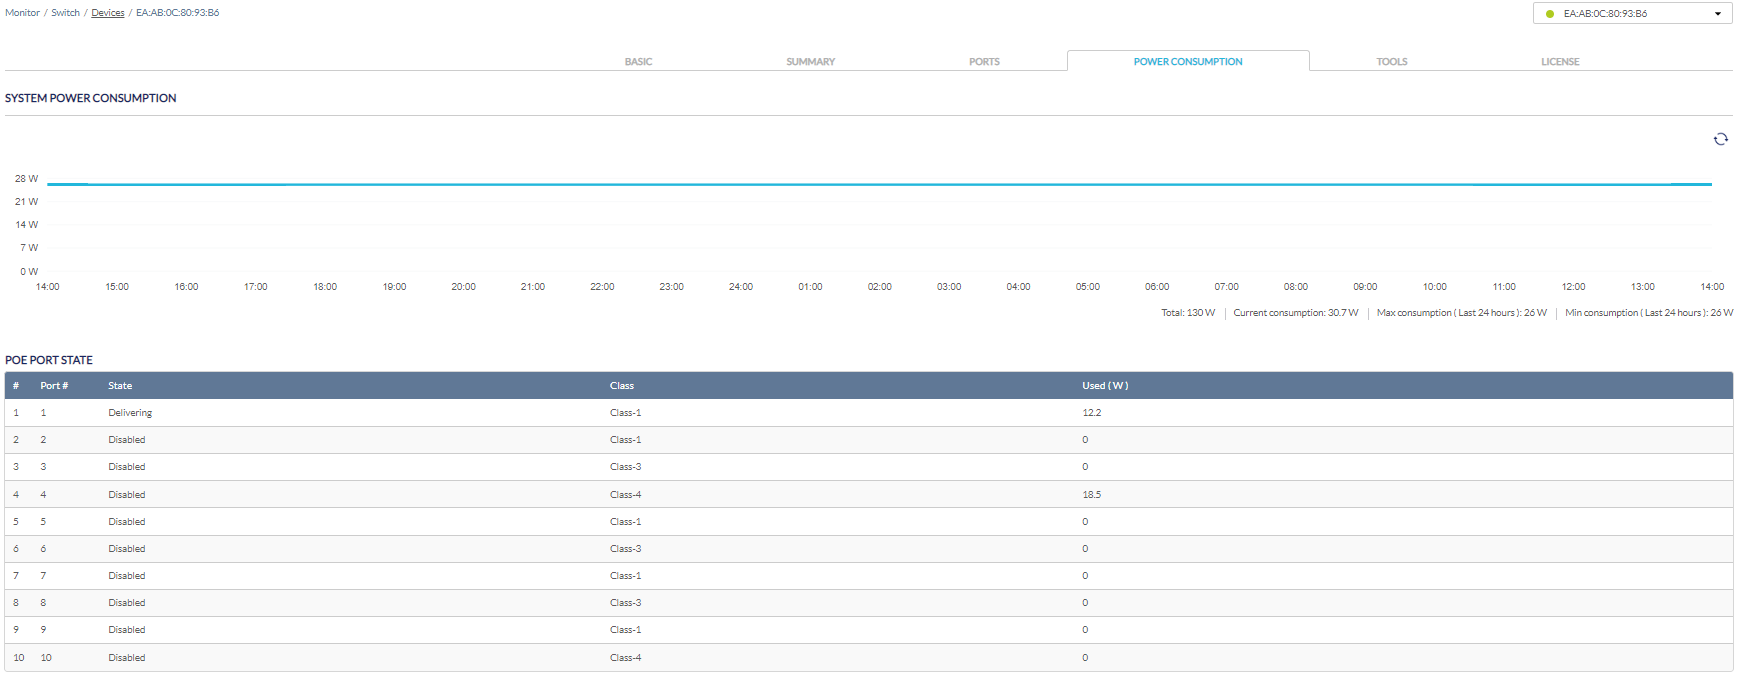
Power Consumption
Viewing and Customizing the Switch Power Consumption Overview
- Navigate to Monitor > Switch > Devices and select a device from the list.
- Select the Power Consumption tab in the top-right of the screen.
Tools
Performing a Device Ping Test
- Navigate to Monitor > Switch > Devices and select a device from the list.
- Select the Tools tab in the top-right of the screen.
- In the IP address/FQDN field in the Ping section, enter a valid IP address or FQDN.
- Click Ping.
Performing a MAC Forwarding Table Test
- Navigate to Monitor > Switch > Devices and select a device from the list.
- Select the Tools tab in the top-right of the screen.
- In the MAC Forwarding Table section, click Run.
Performing a Cable Test
- Navigate to Monitor > Switch > Devices and select a device from the list.
- Select the Tools tab in the top-right of the screen.
- In the Cable Test section, enter the port numbers to run the cable test. Separate multiple port numbers with "," and use "-" for port range, for example, 1,5,7-10.
Note: The scan will only be performed on ports with a physical connection. - Click Test.
Performing a Port Cycle Test
- Navigate to Monitor > Switch > Devices and select a device from the list.
- Select the Tools tab in the top-right of the screen.
- In the Cycle Port section, enter the port numbers to run the port cycle. Separate multiple port numbers with "," and use "-" for port range, for example, 1,5,7-10.
- Click Test.
Performing a Locate Device Test
- Navigate to Monitor > Switch > Devices and select a device from the list.
- Select the Tools tab in the top-right of the screen.
- In the Others section, click Start.
Note: The Start button will change to Stop once the test begins. - Click Stop to end the test.
Manually Rebooting a Device
- Navigate to Monitor > Switch > Devices and select a device from the list.
- Select the Tools tab in the top-right of the screen.
- In the Others section, click Reboot.
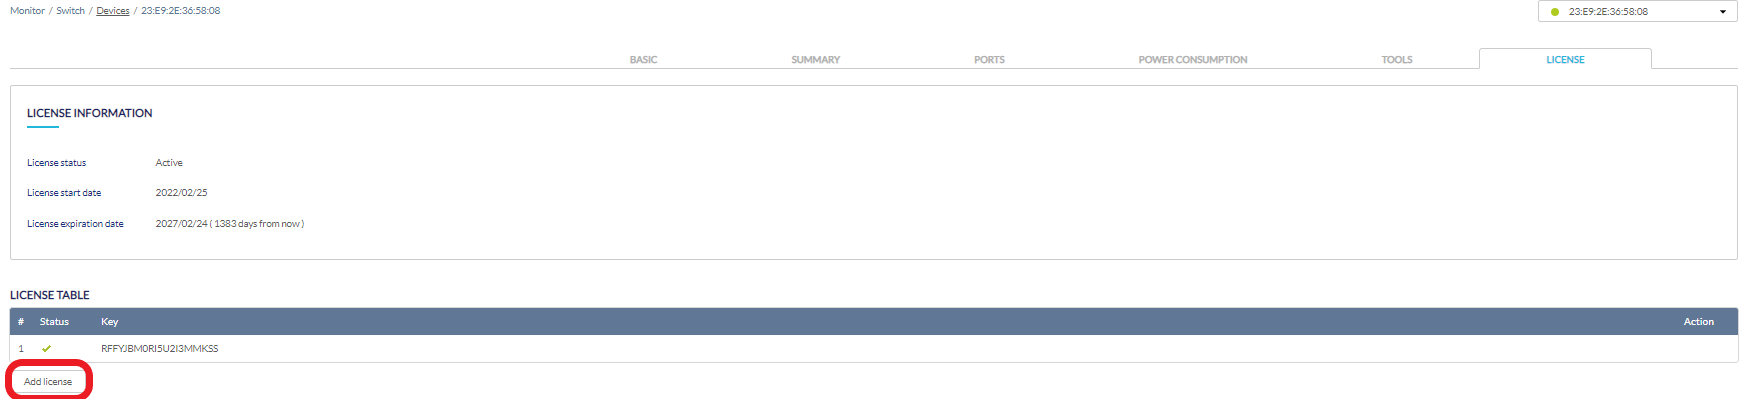
Adding a License Key to a Device
- Navigate to Monitor > Switch > Devices and select a device from the list.
- Select the License tab in the top-right of the screen.
- In the License Table section, click Add License.
- Enter a valid license key.
- Click Save.
Deleting a License Key From a Device
- Navigate to Monitor > Switch > Devices and select a device from the list.
- Select the License tab in the top-right of the screen.
- In the License Table section, from the license key list, click Delete under the Actions column of the license key you wish to delete.
- When prompted to confirm, click Yes.
Note: Deleting a license key from a device will reclassify it as unused in the license management inventory until it is reassigned to another device.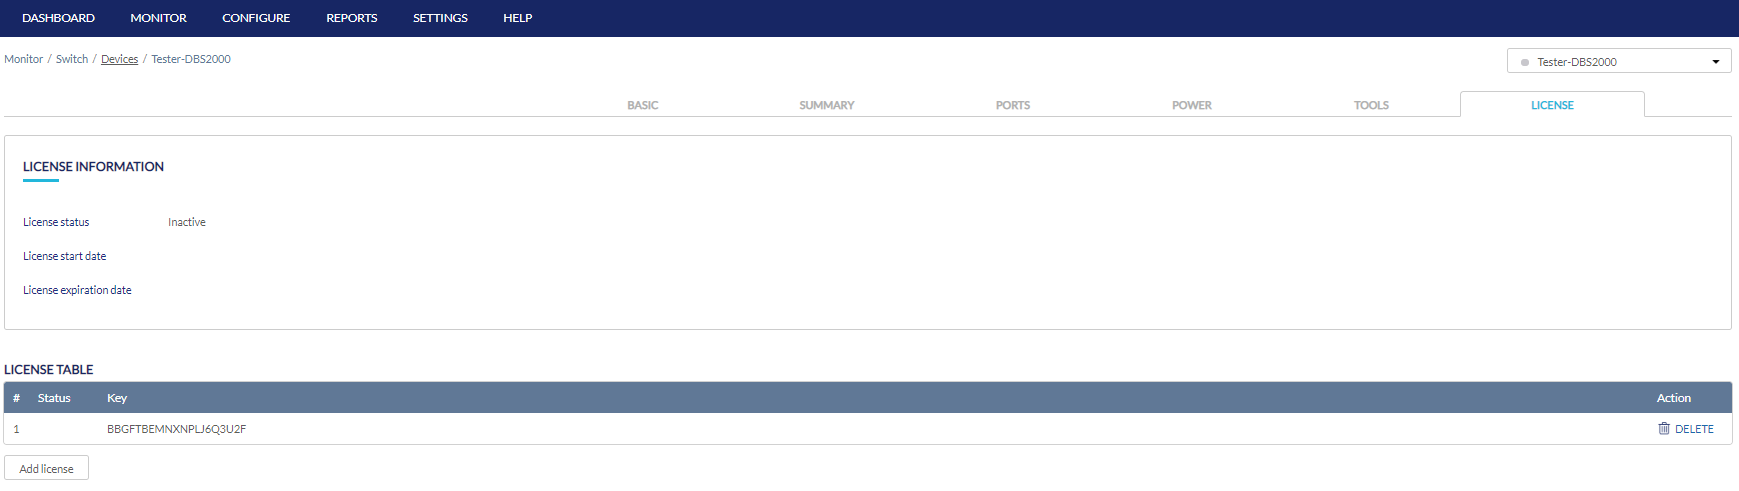
Clients
From the Clients window, you can consult a detailed overview of all currently connected devices with additional information including connected ports, VLAN, and other information such as MAC addresses and LLDP setting.
Customizing the Client Monitor Overview
- Navigate to Monitor > Switch > Clients.
- Select a time frame from the drop-down menu.
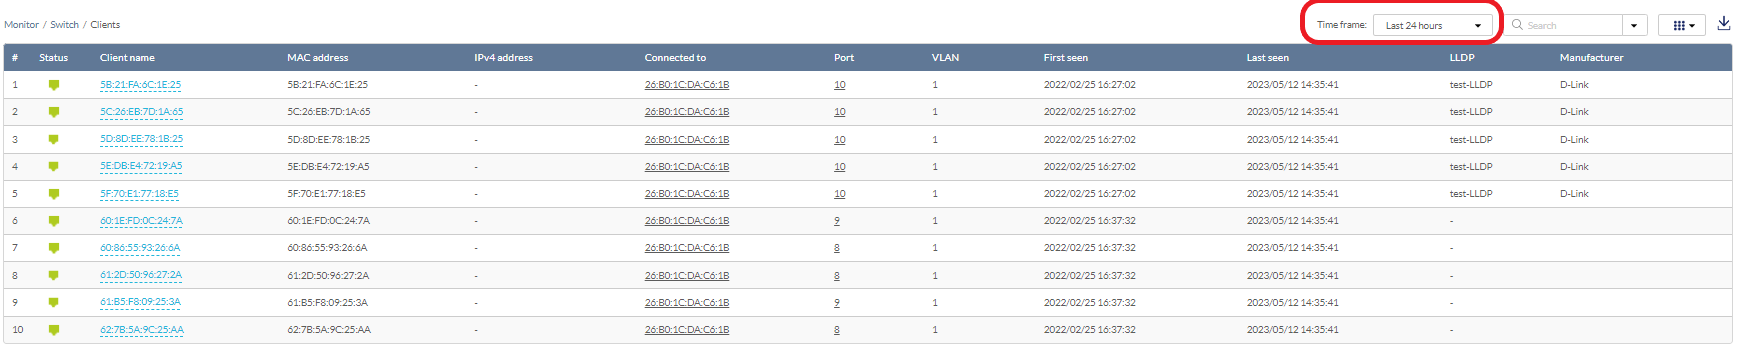
- Click the parameter filter icon.
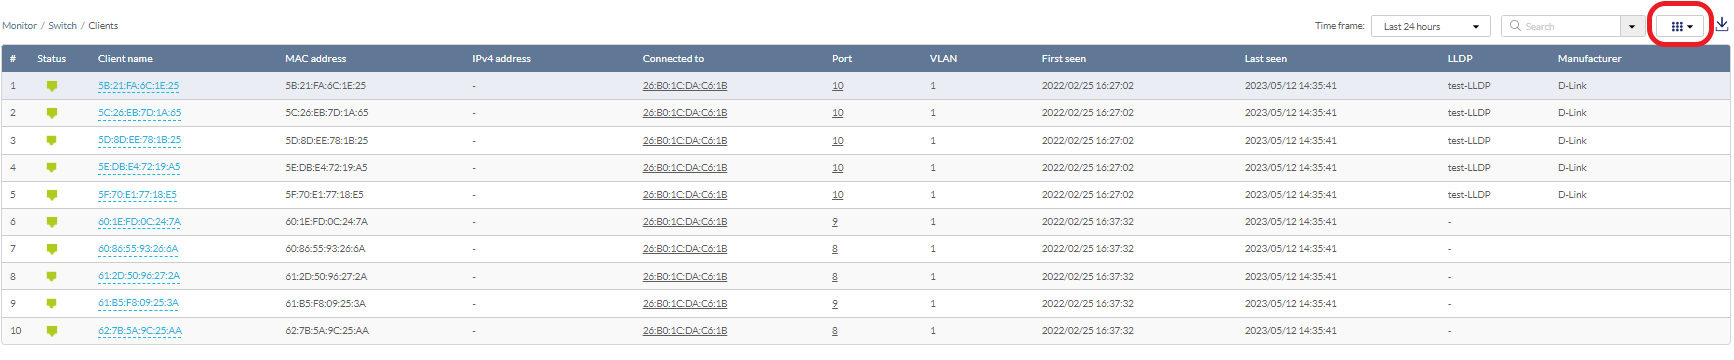
- Click the checkbox next to the parameters to display them in the overview.
Note: All checked parameters will automatically appear.
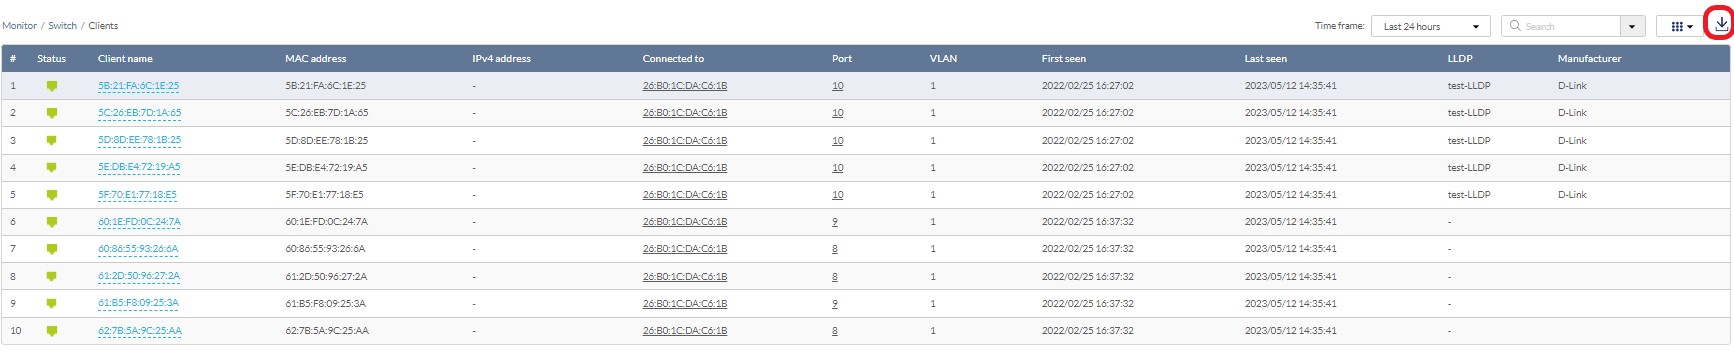
Downloading Client Monitoring Logs
- Navigate to Monitor > Switch > Clients.
- From the device list, click the download icon in the top-right.
Event Log
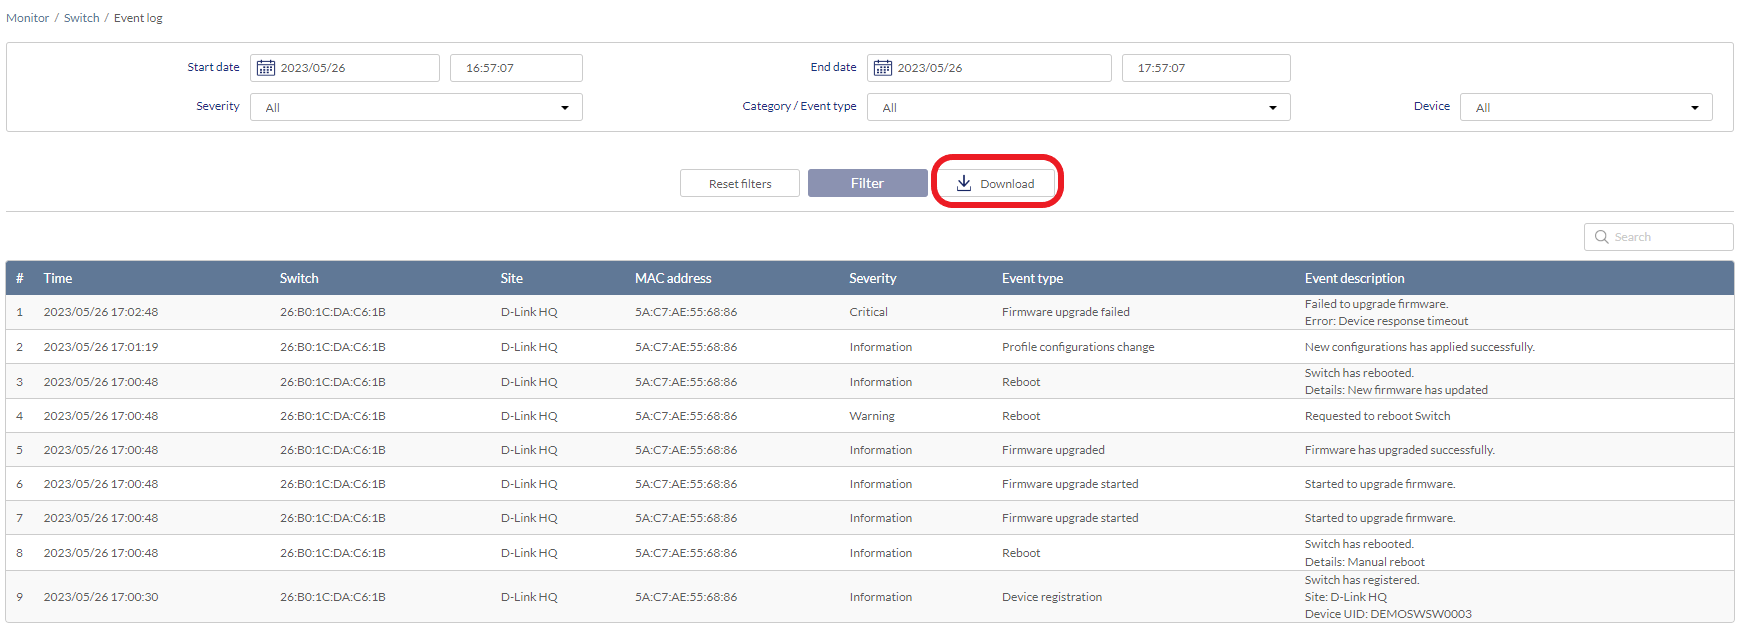
From the Event Logs window, you can consult a detailed log of events occurring on the network. You can define event filter parameters, including event type and time period.
Filtering Event Log Parameters
- Navigate to Monitor > Switch > Event Log.
- In the Start Date field, click the calendar icon to select a date and enter a time of day to define the event log starting time.
- In the End date field, click the calendar icon to select a date and enter a time of day to define the event log ending time.
- Click the Severity drop-down menu and select the severity levels to display. The severity is classified in 3 states: Critical- Indicates major configuration changes or offline/online status changes, Warning - Indicates system reboot events following scheduled firmware upgrade, Information- Indicates device clients association and disassociation events.
- Click the Event type drop-down menu and select the event types to display.
- Click the Device drop-down menu and select a device to filter the results.
Note: Select All to show event logs for all devices. - Click Filter to display all events matching the defined parameters.
- [Optional] Click Reset filters to reset all currently set parameters.
Downloading Event Logs
- Navigate to Monitor > Switch > Event Log.
- From the event log list, click Download.