Monitor - Access Point
Devices
From the Devices window, you can view the AP devices with detailed information such as IP addresses, model name, firmware version, and license information .
Customizing the Device Monitor Overview
- Navigate to Monitor > Access Point > Devices.
- Select a time frame from the time frame drop-down menu to set the duration for connectivity information.
s - Click the filter parameter icon to filter the table properties.
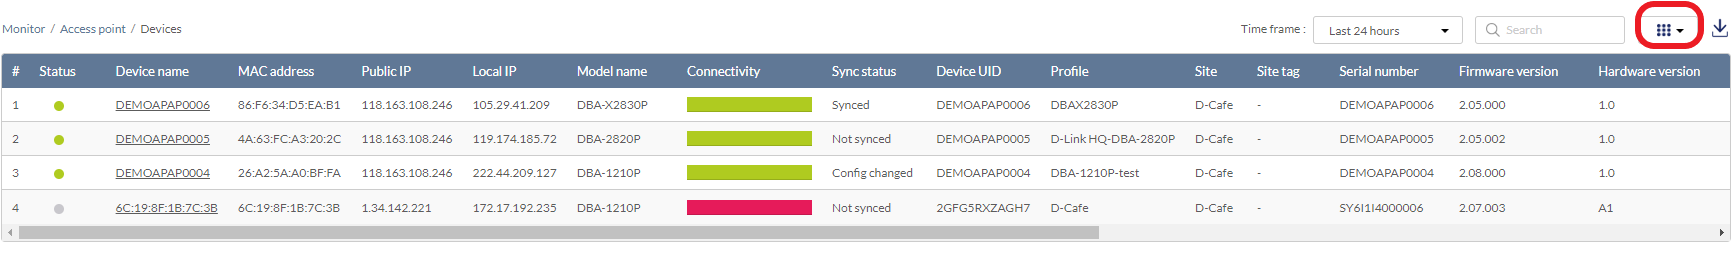
- Click the checkbox next to the parameters to display them in the overview.
Note: All checked parameters will automatically appear.
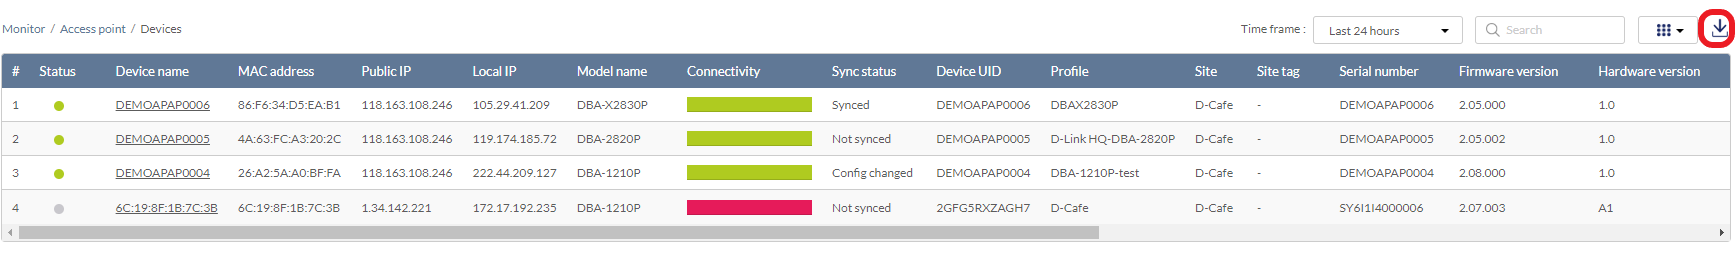
Downloading Device Monitoring Logs
- Navigate to Monitor > Access Point > Devices.
- From the device list, click the Download icon in the top-right.
Clients
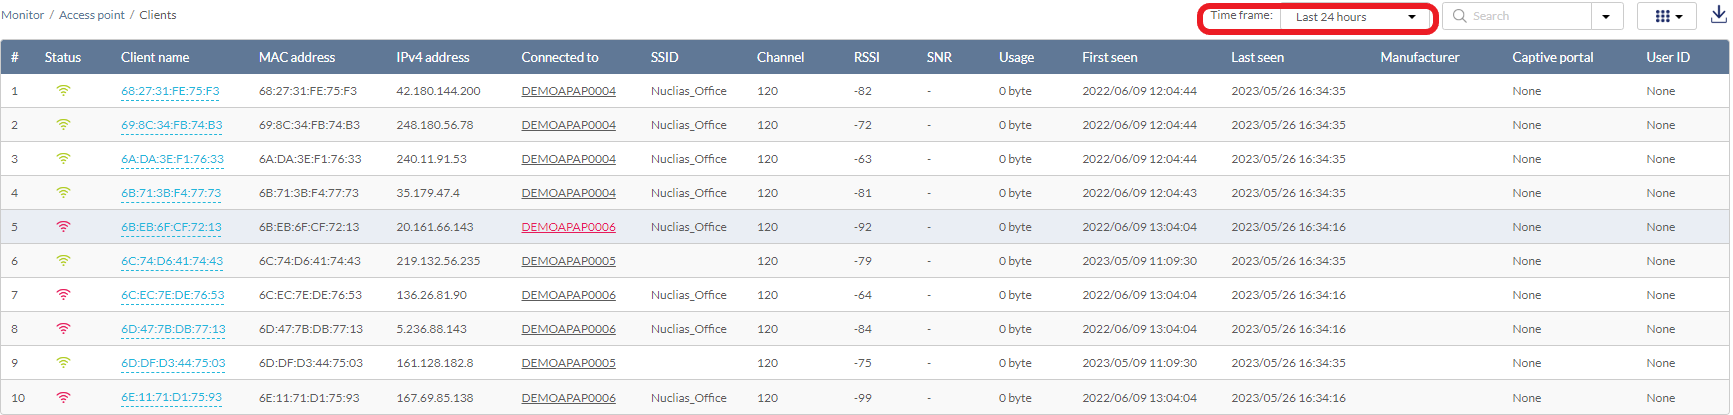
From the Clients window, you can consult a detailed overview of all currently connected clients with additional information such as SSID, channel, and signal strength information.
Customizing the Client Monitor Overview
- Navigate to Monitor > Access Point > Clients.
- Select a time frame from the time frame drop-down menu.
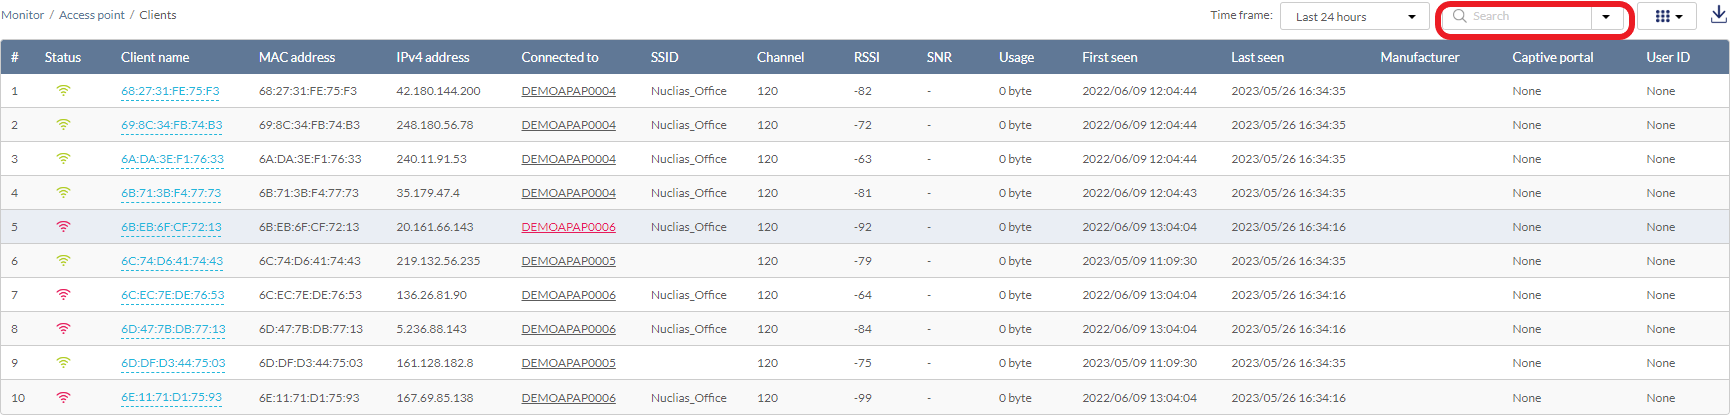
- Select the criteria from the search drop-down menu to filter the list. You can also enter a keyword to search for all fields.
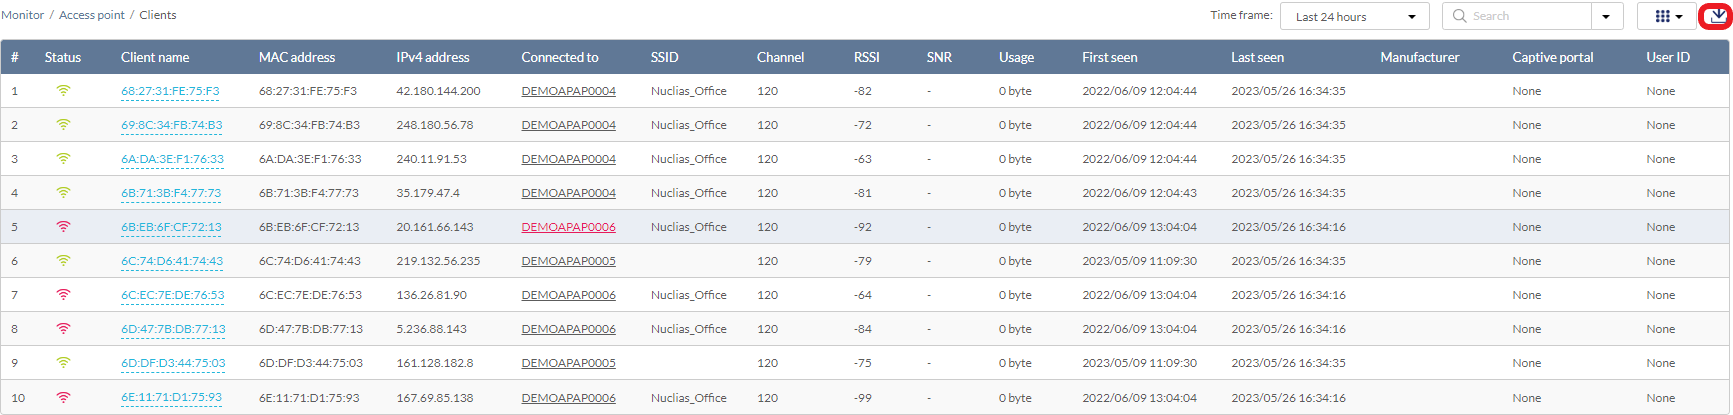
Downloading Client Monitoring Logs
- Navigate to Monitor > Access Point > Clients.
- From the clients list, click the Download icon in the top-right.
Event Log
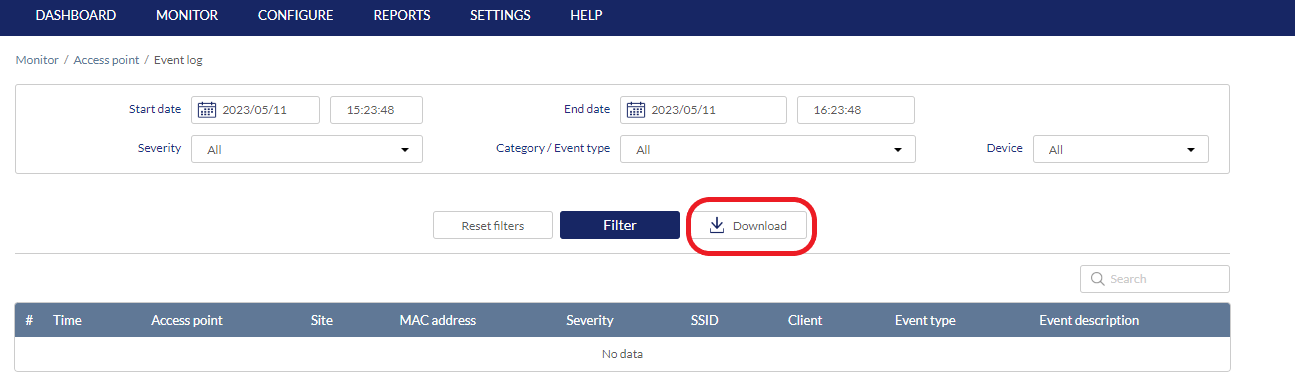
From the Event Log window, you can consult a detailed log of events occurring on the network. You can define event filter parameters, including event type and time period.
Filtering Event Log Parameters
- Navigate to Monitor > Access Point > Event Log.
- In the Start Date field, click the calendar icon to select a date and enter a time of day to define the event log starting time.
- In the End date field, click the calendar icon to select a date and enter a time of day to define the event log ending time.
- Click the Severity drop-down menu and select the severity levels to display. The severity has 3 states: Critical- Indicates major configuration changes or offline/online status changes, Warning - Indicates system reboot events following scheduled firmware upgrade, Information- Indicates device clients association and disassociation events.
- Click the Event type drop-down menu and select the event types to display.
- Click the Device drop-down menu and select the desired device to filter the results.
- Click Filter to display all events matching the defined parameters.
- [Optional] Click Reset filters to reset all currently set parameters.
Downloading Event Logs
- Navigate to Monitor > Access Point > Event Log.
- From the event log list, click Download icon in the center.