Network
The Network page provides information about device availability statistics, bandwidth consumption and connected clients for all types of devices in your organization. For wireless networks, the channel interference information is also provided. Note that you can only view devices in your authorized access level.
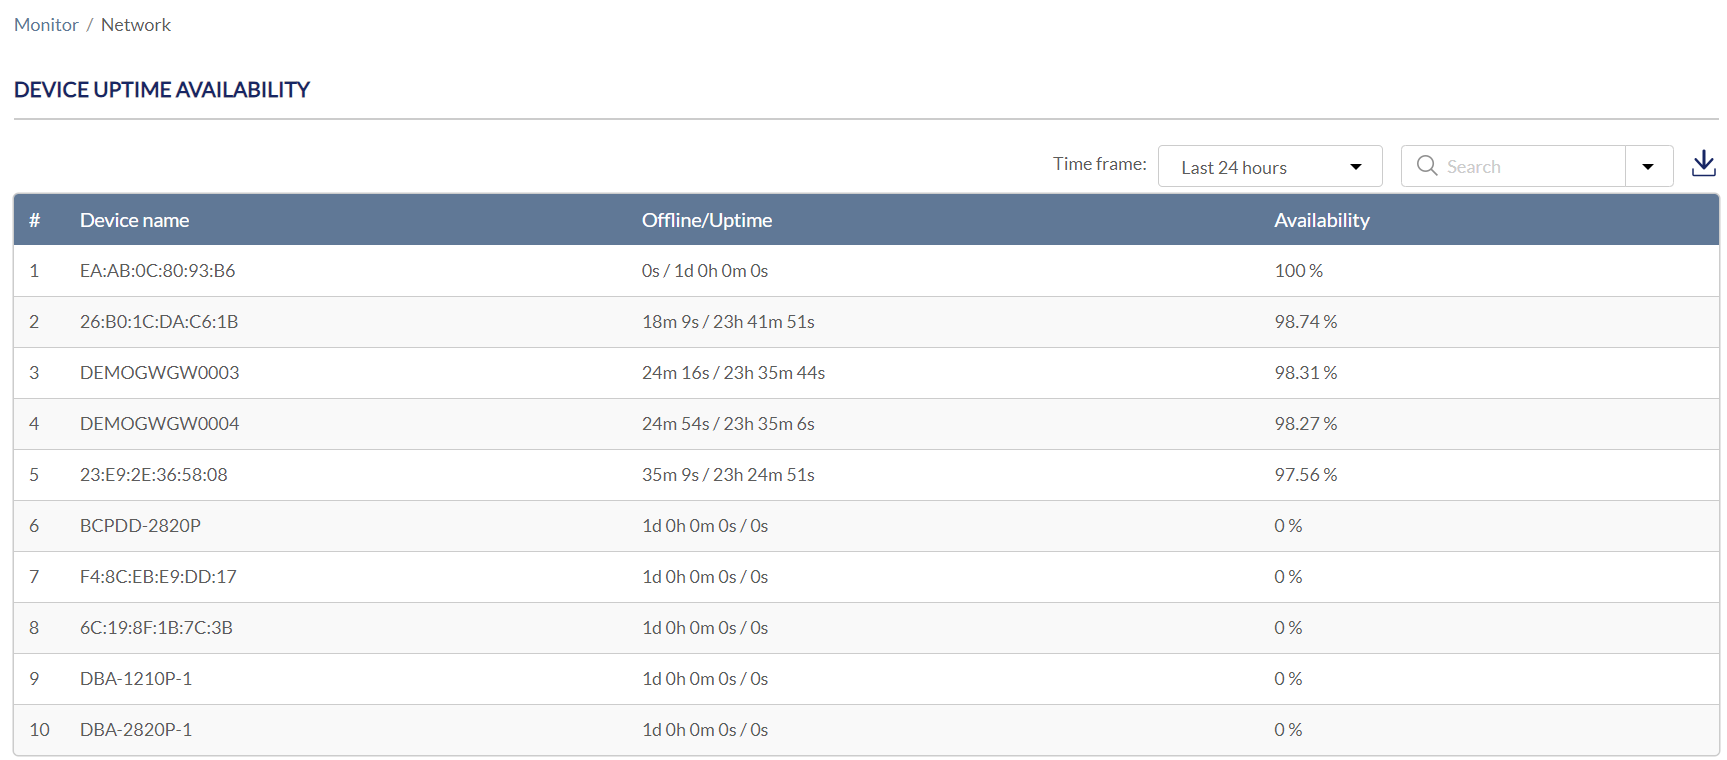
Device Availability Report
- Navigate to Monitor > Network.
- Under Device Uptime Availability, the following information is displayed:
|
Device Name |
The device in your organization. |
|
Offline/Uptime |
The offline duration/uptime duration in the defined time frame. Select the time frame drop-down menu to display the data in last 24 hours, last 7 days, last 14 days, last 30 days, or last 60 days. |
| Availability | The percentage that a device is up and running during the defined time frame. |
-
[Optional] To download the availability report, click Download to download it as a CSV file in your browser's default download folder.
-
[Optional] Select a Site from the Search menu to display the devices assigned to the specified site.
Bandwidth Usage Report
The Bandwidth Usage Report displays the following information:
|
Site Name |
The site in your organization. |
|
Usage |
The total consumption of Internet bandwidth in the defined time frame. Select the time frame drop-down menu to display the data in last 24 hours, last 7 days, last 14 days, last 30 days, or last 60 days. |
-
[Optional] To download the usage report, click Download to download it as a CSV file in your browser's default download folder.
-
[Optional] Select a Site from the Search menu to filter the site in your organization.
Clients Overview
The Clients Overview Report displays the following information:
|
Type |
State whether the client is connected through an Ethernet port or wirelessly. |
|
Client Name |
The connected client's name in the defined time frame. Select the time frame drop-down menu to display the data in last 24 hours, last 7 days, last 14 days, last 30 days, or last 60 days. |
| Site | The site of your organization. |
| MAC Address | The MAC address of the client. |
| IPv4 Address | The IP address of the client. |
| Connected to | The device of the organization that the client is connected to. |
| Usage | The Internet bandwidth consumption. |
| RSSI | Received Signal Strength Indication, which measures the power of a received radio signal. Range: 0 to -120dB. |
| SNR | Signal-to-Noise Ratio, which measures the quality of wireless signal by also taking the noise level into account. Range: 0 to 120dB. |
-
[Optional] To download the client report, click Download to download it as a CSV file in your browser's default download folder.
-
[Optional] Select a Site from the Site drop-down menu.
Channel Overview
The Channel Overview report displays the following information:
|
Channel |
The channel that has been detected having interference. |
|
Interference |
The number of unmanaged wireless networks (SSIDs) operating on this channel. |
| Using | The Nuclias device that uses this channel. |
- [Optional] To download the usage report, click Download to download it as a CSV file in your browser's default download folder.
- [Optional] Select a wireless Device (grouped by Site) from the Device drop-down menu to display only the device in your organization.