Dashboard
The Dashboard page is the default window that is displayed after logging in to the Nuclias Cloud Portal interface. It can also be reached by clicking the Dashboard tab in the tool bar. It provides an overview of the devices belonging to the selected site, connected clients of the devices, and device statistics for the selected site. You can also customize the dashboard by selecting the widgets and rearranging them to suit your needs.
Customizing the Overview

- Navigate to the Dashboard page.
- Select a Site from the Site menu.
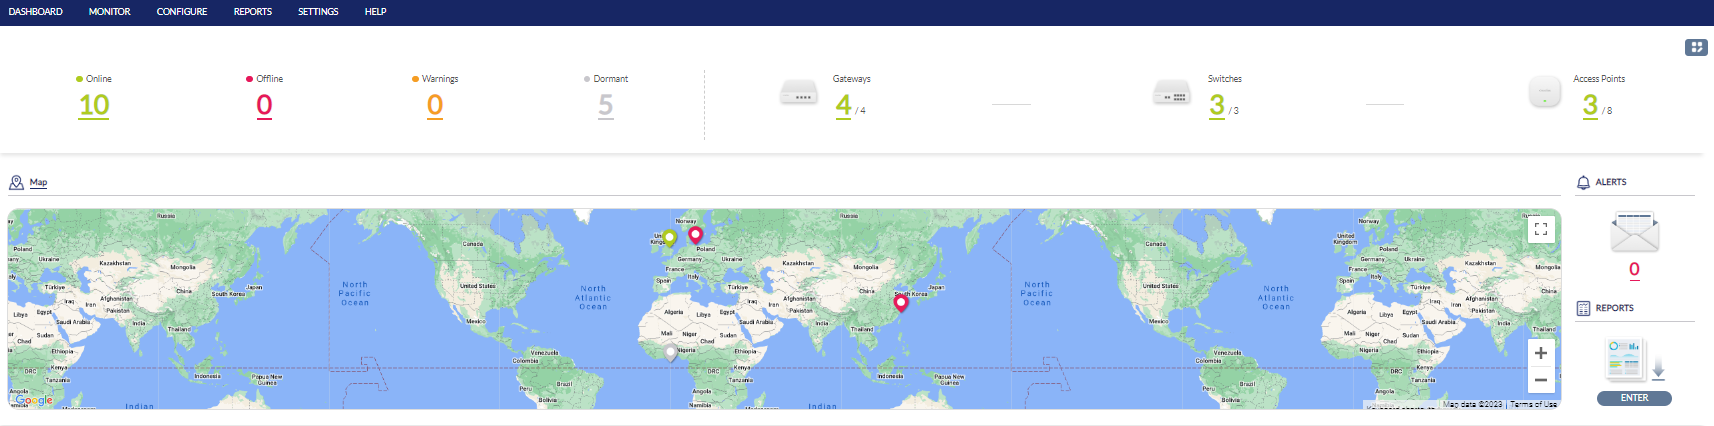
Note: Selecting a Site will only show device and utilization information for the selected Site. - The top widget shows the the online/total (devices) for each product category.
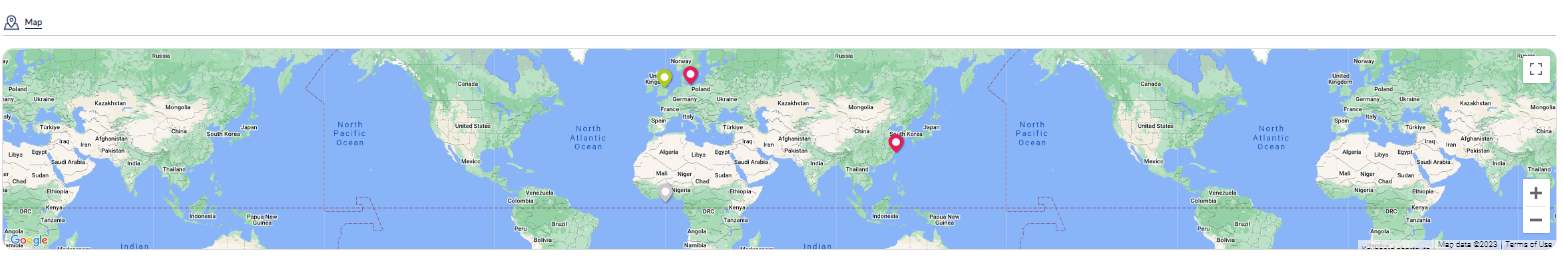
- The Map widget shows the site information as well as the device status. Click a site on the map to display such information.
-
The Alert and Report next to the map provides links to the Alerts and Summary Report page of the Reports menu.
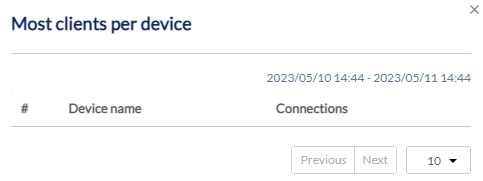
- In the Last 24 Hours Summary section, click the title of the reports to obtain the ranks in different statistic category. For example, click Most clients per device to show the top devices with the most clients in the past 24 hours.
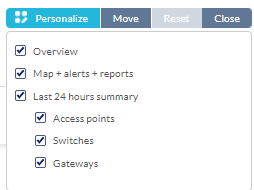
- Click the layout icon
 at the top right to customize the statistic widgets to be displayed. For example, deselect the Map widget to hide geolocation information of sites and their devices. Click Move to arrange the widget blocks on the page. You can click Reset to reset the display and then click Close to close the layout customization control.